After the dust settles and some fundamental analysis is attempted, what analysts will try to calculate is which S&P500 sectors, and companies, have the most exposure to a post-Brexit UK, a country whose growth expectations have been slashed in angry retribution by all those sellside strategists and experts whose "scaremongering advice" was ignored, and which many banks now expect will promptly enter recession (for the variant perception read Albert Edwards' latest note, according to whom the dramatic sterling devaluation is precisely what the UK economy needs).
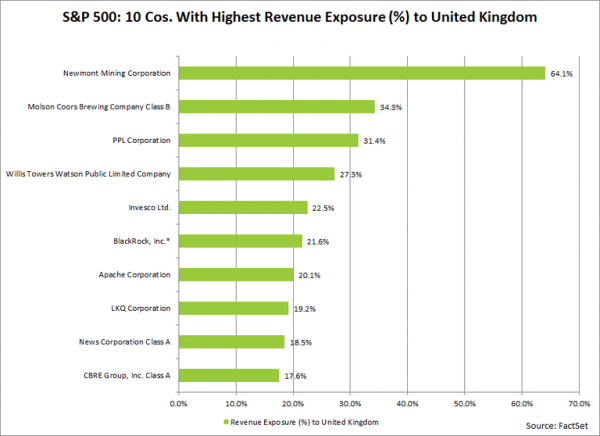
One place to start would be the following analysis from Factset, which analyses which sectors and companies in the index have the highest revenue exposure to the UK?
According to FactSet Market Aggregates and FactSet Geographic Revenue Exposure data (based on the most recently reported fiscal year data for each company in the index), the aggregate revenue exposure of the S&P 500 to the United Kingdom is 2.9%. This is the third highest country-level revenue exposure for the index, trailing only the United States (68.8%) and China (4.9%).
At the sector level, the Energy (6.4%), Information Technology (4.0%), and Materials (3.7%) sectors have the highest revenue exposures to the United Kingdom.
At the company level, 30 companies in the S&P 500 have revenue exposure of more than 10% to the United Kingdom, led by Newmont Mining (64%), Molson Coors Brewing (34%), and PPL Corporation (31%).
It is interesting to note that since February 20 (the date the UK announced the June 23 timeline for the EU vote), the companies in the S&P 500 with more revenue exposure to the UK have seen higher average and median price increases relative to the index as a whole.
For the entire S&P 500 index, the average price change for a stock from February 20 through June 16 was +11.3%. For the companies in the index with more than 10% revenue exposure to the United Kingdom, the average price change for a stock over this period was +16.7%. For the entire S&P 500 index, the median price change for a stock from February 20 through June 16 was +9.6%. For the companies in the index with more than 10% revenue exposure to the United Kingdom, the median price change for a stock over this period was +14.3%.
Courtesy Tyler Durden, founder of Zero Hedge
The views and opinions expressed herein are the author's own, and do not necessarily reflect those of EconMatters. � EconMatters All Rights Reserved | Facebook | Twitter | YouTube | Email Digest | Kindle


It is really very helpful for us and I have gathered some important information about your blog thanks for sharing your blog.
ReplyDeleteHighest Exposure