Showing posts with label commodities. Show all posts

Thursday, June 23, 2016

Why $50 Oil Does Not Work

$50 per barrel oil is clearly less impossible to live with than $30 per barrel oil, because most businesses cannot make a profit with $30 per barrel oil. But is $50 per barrel oil helpful?
I would argue that it really is not.
When oil was over $100 per barrel, human beings in many countries were getting the benefit of most of that high oil price:
  • Some of the $100 per barrel goes as wages to the employees of the oil company who extracted the oil.
  • Often, the oil company contracts with another company to do part of the oil extraction. Part of the $100 per barrel is paid as wages to employees of the subcontracting companies.
  • An oil company buys many goods, such as steel pipe, which are made by others. Part of the $100 per barrel goes to employees of the companies making the goods that the oil company buys.
  • An oil company pays taxes. These taxes are used to fund many programs, including new roads, schools, and transfer payments to the elderly and unemployed. Again, these funds go to actual people, as wages, or as transfer payments to people who cannot work.
  • An oil company pays dividends to stockholders. Some of the stockholders are individuals; others are pension funds, insurance companies, and other companies. Pension funds use the dividends to make pension payments to individuals. Insurance companies use the dividends to make insurance premiums affordable. One way or another, these dividends act to create benefits for individuals.
  • Interest payments on debt go to bondholders or to the bank making the loan. Pension plans and insurance companies often own the bonds. These interest payments go to pay pension payments of individuals or to help make insurance premiums more affordable.
  • A company may have accumulated profits that are not paid out in dividends and taxes. Typically, they are reinvested in the company, allowing more people to have jobs. In some cases, the value of the stock may rise as well.
When the price falls from $100 per barrel to $50 per barrel, the incomes of many people are adversely affected. This is a huge negative with respect to world economic growth.
If the price of oil drops from $100 per barrel to $50 per barrel, this change adversely affects the income of a large share of people who formerly benefited from the high price. Thus, the drop in oil prices affects the incomes of many of the people listed in the previous section.
Furthermore, this drop in income tends to radiate outward to the rest of the economy because each worker who is laid off is forced to purchase fewer discretionary items. These workers are also less able to take on new debt, such as to buy a new car or house. In some cases, they may even default on existing debt.
A drop in oil prices from $100+ per barrel to $50 per barrel leads to job layoffs by oil companies and their subcontractors. Oil companies and their subcontractors may even reduce dividends to shareholders.
While oil prices have recently been as low as $30 per barrel, the subsequent rise in prices to $50 per barrel is not enough to start adding new production. Prices are still far too low to encourage new development.
In 2016, other commodities besides oil have a problem with price below the cost of production.
Many commodities, including coal and natural gas, are currently affected by low prices. So are many kinds of metals, and some kinds of food commodities. Thus, there is pressure in a wide range of industries to lay off workers. There are many parts of the world now feeling recessionary forces.
As prices fall, the pressure is for high-cost producers to drop out. As this happens, the world�s ability to make goods and services falls. The size of the world economy tends to shrink. This shrinkage is clearly not good for a world economy that needs to grow in order for investors to earn a profit, and in order for debtors to repay debt with interest.
Growing demand comes from a combination of increasing wages and increasing debt.
The recent drop in oil prices from the $100+ level seems to come from inadequate demandfor oil. This is equivalent to saying that oil at such a high price has not been affordable for a significant share of buyers. We can understand what might have gone wrong, by thinking about how demand for oil might be increased.
Clearly, one way of increasing demand is through increased productivity of workers. If this increased productivity allows wages to rise, this increased productivity can cycle back through the economy as increased demand for goods and services. We can think of the process as an �economic growth pump� that allows continued economic growth.
Generally, increased productivity of workers reflects the use of more capital goods, such as machines, vehicles, and buildings. These capital goods are made using energy products, and operate using energy products. Thus, energy consumption is an important part of the economic growth pump. These capital goods are frequently financed using debt, so debt is another important part of the economic growth pump.
Even apart from the debt necessary for financing capital goods, another way of increasing demand is by adding more debt. If a company adds more debt, it can often hire more workers and can add to its holdings of property. These also help raise the output of the company. As long as the output that is added is sufficiently productive that it can repay the added debt with interest, adding more debt tends to enhance the workings of the economic growth pump.
The way governments have attempted to encourage the use of increased debt in recent years is by decreasing interest rates. The reason this approach is used is because with a lower interest rate, a broader range of investments can seem to be profitable, after repaying debt with interest. Even very �iffy� investments, such as extraction of tight oil from the Bakken, can appear to be profitable.
The extent of the decrease in interest rates since 1981 has been amazingly large.
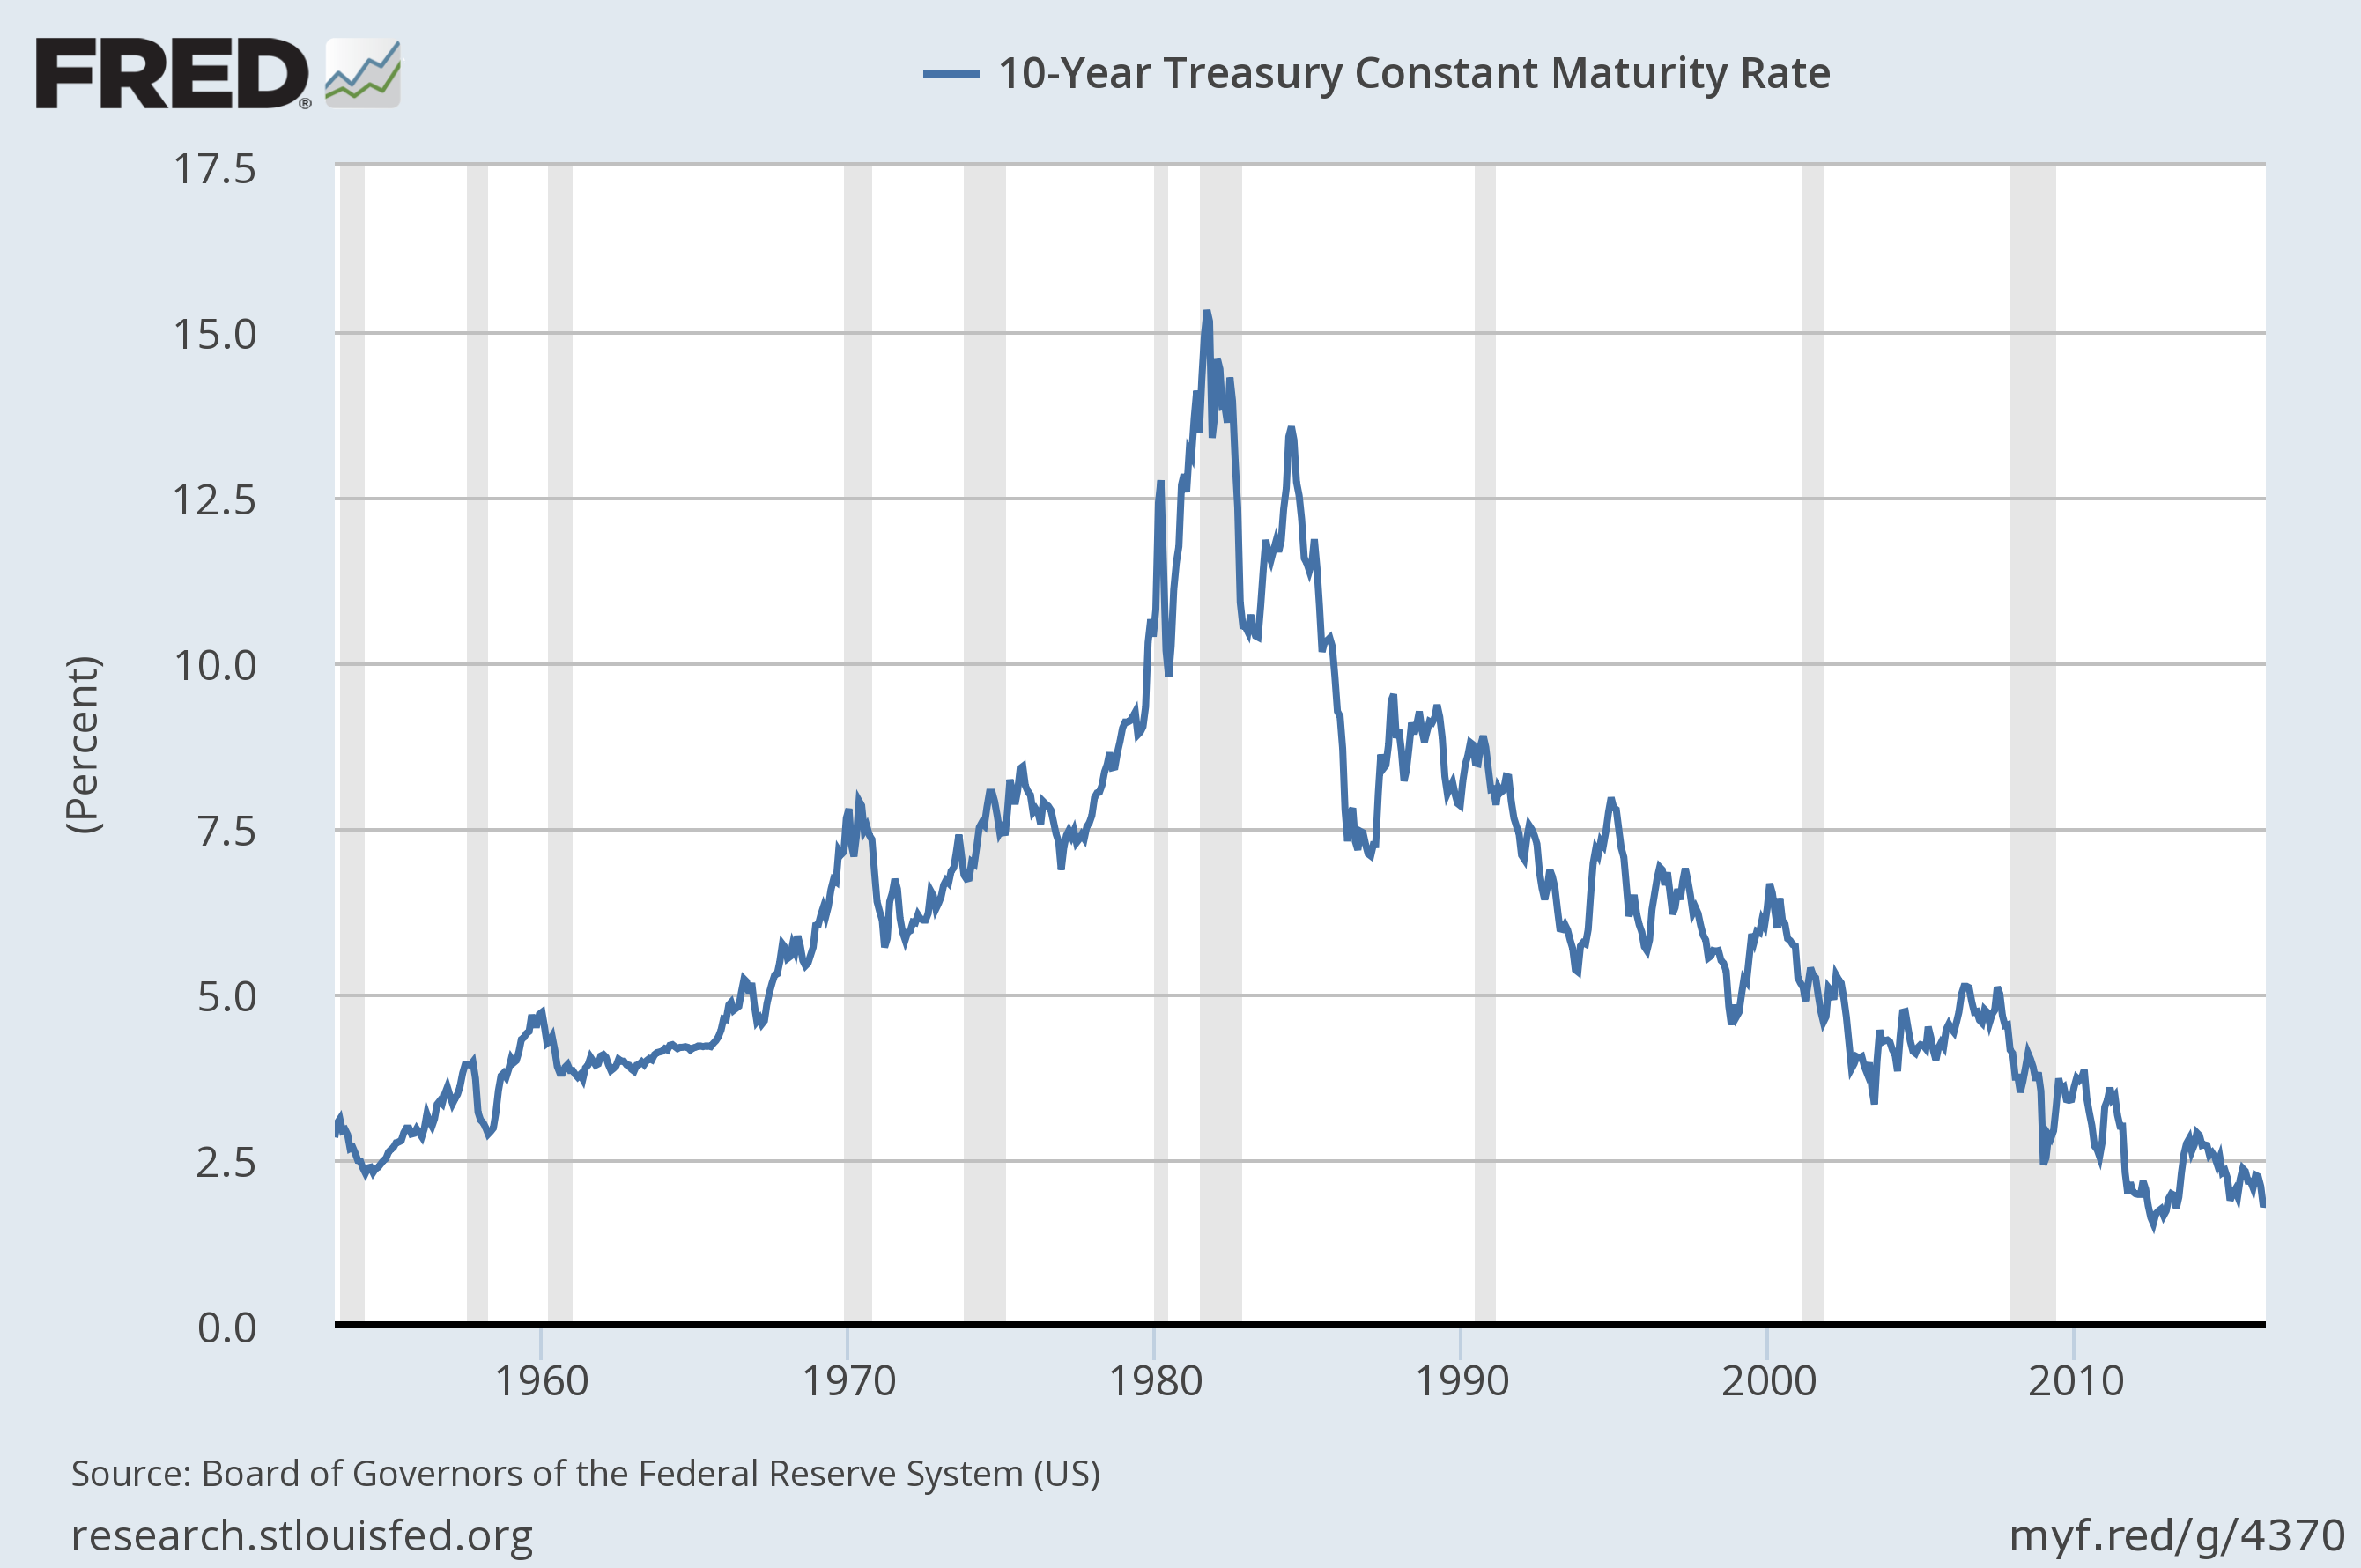
Figure 1. Ten year treasury interest rates, based on St. Louis Fed data.
Since 2008, additional steps have been taken to decrease interest rates even further. One of these is the use of Quantitative Easing. Another is the recent use of negative interest rates in Europe and Japan.
Falling demand would seem to suggest that the world�s economic growth pump is no longer working properly. This is happening, even with all of the post-1981 manipulations of interest rates to reduce the cost of borrowed capital, and thus reduce the required threshold for profitability of new investments.
What could cause the economic growth pump to stop working?
One possibility is that accumulated debt reaches too high a level, based on historical parameters. This seems to be happening now in many parts of the world.
Another thing that could go wrong is that the price of oil rises so high that capital goods based on oil are no longer cost effective for leveraging human labor. If this happens, manufacturing is likely to move to countries that use a cheaper mix of fuels, typically including more coal. The shift of manufacturing to China seems to reflect such a change.
A third thing that could go wrong is that pollution becomes too great a problem, forcing a country to slow down economic growth. This seems to be at least part of China�s current problem.
If oil prices drop from $100 to $50 per barrel, this has an adverse impact on debt levels.
With lower oil prices, workers are laid off, both from oil companies and from companies that provide goods and services to oil companies. These workers, in turn, are less able to take on new debt. In some cases, they may also default on their debt.
Oil companies with reduced cash flow are also less able to repay their debt. In some cases, companies may file for bankruptcy. The result is generally that existing debt is �written down.� Even if an oil company does not file for bankruptcy, it is likely to have difficulty adding new debt. The trend in the amount of debt outstanding is likely to change fromincreasing to decreasing.
As the amount of debt shifts from increasing to decreasing, the economy tends to shift from increasing to shrinking. Instead of adding more employees, companies tend to reduce the number of employees. If many commodities are affected, the impact can be very large.
We need oil prices to rise to $120 per barrel or more.
The current price of $50 per barrel is still way too low. A post I published in February 2014 was called Beginning of the End? Oil Companies Cut Back on Spending. In it, I talked about an analysis by Steve Kopits of Douglas-Westwood. In this analysis, Kopits points out that even at that time�which was before oil prices began dropping in mid-2014�major oil companies were beginning to cut back on spending for new production. Their cost of production was at that time typically at least $120 or $130 per barrel, if prices were to be high enough so that companies could fund new development without adding huge amounts of new debt. Oil prices could perhaps be lower if oil companies could fund their operations using large increases in debt. Company management recognized that such a funding approach would not be prudent�it could lead to unmanageable debt levels.
Today�s cost of oil production is likely to be even higher than it was when Kopits� analysis was performed in early 2014. If we expect oil production to continue to rise, we probably need oil prices in the $120 to $150 per barrel range for several years. Prices at such a level are likely to be way too high for consumers, because wages do not rise at the same time as oil prices. Consumers find that they need to cut back on discretionary expenditures. These spending cutbacks tend to lead to recession and falling oil prices.
We can think of our economy as being like a big ball, which can be pumped up to greater and greater size with either rising productivity or rising debt.
This process can continue to work, only as long as the debt added is sufficiently productive that it is possible to repay the debt with interest. We seem to be reaching the end of the line on this process. Returns keep falling lower and lower, necessitating ever-lower interest rates.
To some extent, the pumping up of oil prices that occurs in this process represents a lie, because the energy content of a barrel of oil remains unchanged, regardless of price. In fact, the energy of coal and of natural gas per unit of production remains unchanged as well. The value of energy products to society is determined by their physical ability to leverage human labor�for example, how far diesel oil can move a truck. This ability is unchanged, regardless of how expensive that oil is to produce. This is why, at some point, we find that high-priced energy products simply don�t work in the economy. If we spend the huge amount of resources required for the production of energy products, we don�t have enough resources left over for the rest of the economy to grow.
Low oil prices, plus low commodity prices of other kinds, seem to indicate that we are reaching the end of the line in the �pump up the economy with debt� approach. We have been using this approach since 1981. At this point, we have no idea what economy growth would look like, without the stimulus of falling interest rates.
The drop in oil prices and other commodity prices since mid-2014 seems to represent a �shrinking back� of our ability to use debt to raise prices to a level sufficient to cover the cost of extraction, plus associated overhead costs, including taxes. This drop in prices should be an alarm bell that something is seriously wrong. Without continuously rising prices, to keep up with ever-rising extraction costs, fossil fuel production will at some point come to a halt. Renewables will not work well either, because prices will not be high enough for them to be competitive.
Of course, once the economy stops growing, the huge amount of debt we have amassed becomes un-payable. The whole system we have built will begin to look more and more like a Ponzi Scheme.
We are blind to the possibility that oil prices of $50 per barrel may indicate that we are reaching �the end of the line.�
The popular belief is that everything will work out fine. Oil prices will rise a bit, and somehow the economy will get along with less fossil fuel. Somehow, we will make it through this bottleneck.
If we would study history, we would discover that there have been many situations of overshoot and collapse. In fact, those situations tend to look quite a bit like the situation we are seeing today:
  • Falling resources per capita, because of rising population or exhaustion of resources
  • Falling wages of non-elite workers; greater wage disparity
  • Governments finding it increasingly difficult to fund needed programs
There is a popular belief that oil prices will rise, if there is a shortage of energy products. In prior collapses, it is not at all clear that prices have risen. We know that when ancient Babylon collapsed, demand for all products, even slaves, fell. If we are reaching collapse now, we should not be surprised if the prices of commodities, including oil, stay low. Alternatively, they might spike, but only briefly�not enough to really fix our current situation.
Too many wrong theories
Part of our problem is too much confidence that the �magic hand� of supply and demand will fix the economy. We don�t really understand how demand is tied into affordability, and how affordability is tied into wages and debt. We don�t realize that the view that oil prices can rise endlessly is more or less equivalent to the view that economic growth can continue indefinitely in a finite world.
Another part of our problem is failure to understand how the economic pump that keeps the economy operating works. Once debt rises too high, or the cost of energy extraction rises too high, we can no longer keep the system going. Price tends to fall below the cost of energy extraction. The quantity of energy products consumed cannot rise fast enough to keep the economic growth pump operating.
Clearly neoclassical economics doesn�t properly model how the economy really works. But the Energy Returned on Energy Invested (EROEI) theory of Biophysical Economics does not model the current situation well, either. EROEI theory is generally focused on the ratio of Energy Returned by some alternative energy device to Fossil Fuel Energy Used by the same alternative energy device. This focus misses several important points:
  1. The quantity of energy consumed by the economy needs to keep rising, if human productivity is to keep growing, and thus allow the economy to avoid collapsing. EROEI calculations normally have little to say about the quantity of energy products.
  2. The quantity of debt required to produce a given amount of energy by an alternative energy device is very important. The more debt that is added, the worse the alternative energy device is for the economy.
  3. In order for the economic growth pump to keep working, the return on human labor needs to keep rising. This is equivalent to a need for the wages of non-elite workers to keep rising. This is a requirement relating to a different kind of EROEI�energy return on human labor, leveraged with various types of supplemental energy. Today�s EROEI theorists tend to overlook this type of EROEI.
EROEI theory is a simplification that misses several important parts of the story. While a high fossil fuel EROEI is necessary for an alternative to substitute for fossil fuels, it is notsufficient. Thus, EROEI analysis tends to produce �false favorable� results.
Lining up resources in order by their EROEIs seems to be a useful exercise, but, in fact, the cut-off likely needs to be higher than most have supposed, in order to keep total costs low enough so that the economy can really afford a given energy source. In addition, resources that add heavily to debt requirements are probably unhelpful, regardless of their calculated EROEIs.
Conclusion
We are certainly at a worrying point in history. Our networked economy is more complex than most researchers have considered possible. We seem to be headed for collapse because of low prices, rather than high. The base scenario of the 1972 book �The Limits to Growth,� by Donella Meadows and others, seems to indicate that the world will likely reach limits about the current decade.
The modeling done in 1972 laid out the basic situation, but could not be expected to explain precisely how collapse would occur. Now that we are reaching the expected timeframe, we can see more clearly what seems to be happening. We need to be examining what is really happening, rather than tying ourselves to outdated ideas of how the economic system works, and thus, what symptoms we should expect as we approach limits. It may be that $50 per barrel oil is one of the signs that collapse is not far away.
Courtesy Gail Tverberg, Founder of Our Infinite World (More by Gail Here)
The views and opinions expressed herein are the author's own, and do not necessarily reflect those of EconMatters.

EconMatters All Rights Reserved | Facebook | Twitter | YouTube | Email Digest | Kindle

Wednesday, June 22, 2016

Increase In U.S. Rig Count Will Not Cap Oil Prices

The impact of rising oil prices on North American light tight oil (LTO) production is said to be a �Catch 22�, the title of Joseph Heller�s popular 1961 novel set in WWII. The premise was you could get out of the army if you were crazy but you weren�t crazy to try to get out of the army. So this avenue to escape the war didn�t work for the book�s main character John Yossarian.

Too many analysts continue to believe drilling and service has the same problem with rising oil prices. With WTI back above $50 a barrel � at least briefly last week � North American LTO developers are putting rigs, service equipment and personnel back to work. The so-called �fraclog� or �DUC� inventory (wells drilled but uncompleted) is being reduced. While this is good it is also thought by some to be temporary.

Those who study crude prices have correctly observed it was the 4 million barrels per day (b/d) increase in U.S. LTO production that contributed greatly to the 2014 oil price collapse. So if the price of oil is now high enough to make LTO economic again some believe the reward will either be a cap on further price increases or the foundation of the next collapse. The Catch 22 is if oil prices rise high enough to put drilling and service back to work then it won�t last long.

Maybe.

To this writer the most meaningless indicator of the future of world oil prices has been the weekly U.S. oil rig count published by Baker Hughes and opined upon regularly by oil analysts and writers since late 2014. That�s when it became an important world oil price driver for the first time. The argument emerged that having contributed to the collapse of world oil prices, U.S. LTO was the new global �swing producer�, replacing OPEC leader Saudi Arabia in that role. If and when prices rose the U.S. rig count would rise and ultimately cause prices to fall again. If prices went too low the LTO operators couldn�t afford to drill, which would shrink supply and cause prices to rise.

This is materially different than prolific oil producer Saudi Arabia, which established its swing producer credentials over several decades merely by opening and closing valves. The geological and commercial differences between the two couldn�t be more glaring. In the Middle East a single state oil company is exploiting arguably the most prolific reservoirs in the world. A state-controlled entity can do whatever it wants including shutting in production to manipulate prices without fear of prosecution.

In the U.S. hundreds of operators run thousands of rigs to exploit arguably some of the most expensive and geologically complex reservoirs in the world. If they somehow collude to restrict supply to affect prices they will be prosecuted and perhaps sent to jail. Whoever came up with this idea really should do more homework.

Nevertheless, the comparison got legs and away it went. With world oil prices being a huge business story analysts started to focus their attention on the weekly U.S. oil rig count as a precursor of when U.S. LTO would fall. Every Friday the Baker Hughes rig count would wiggle. If it went down WTI might tick up. If it went up WTI might tick down. WTI is the most heavily traded and speculative commodity in the world some days trading 1,000 times as many �dry� barrels (futures contracts) as �wet� barrels (actual oil production priced off WTI).

Besides massive futures trading, the other factors affecting WTI include the value of the U.S. dollar (it rises and WTI falls), OPEC production, world oil demand, North American and U.S. storage, Iranian crude embargoes, and periodic and unplanned supply disruptions from everywhere from Libya to Nigeria to Fort McMurray.

Regardless, the U.S. oil rig count regularly makes the news and affects the price of WTI. The following chart shows the figures for the past 19 months since it peaked in October of 2014 at 1,609 and hit the lowest level in years at only 316 in late May, merely 20 percent of the high water number.


The collapse of the American rig count and subsequent decline in LTO output has indeed contributed mightily to rebalancing world oil markets. According to the Energy Information Administration (EIA) U.S. oil production is down nearly 1 million b/d in the past year. The EIA reported June 14 that it expects LTO output to fall by another 118,000 b/d by July, mostly from the Bakken and Eagle Ford.

Assisted by this and other factors, WTI has been one of the top performing commodities since it closed at the lowest price in over a decade at only $26.19 on February 11. It has risen almost steadily to reach the highest price since last July on June 8 when it closed at $51.23, a whopping 96 percent increase. In the past week two things have occurred: WTI has lost about $3 a barrel and on June 10 the U.S. oil-targeted rig count had risen by 12 to 328.

This modest uptick in the rig count once again caused concern and prognostication on the future of oil prices. In a Globe and Mail story June 10 a New York oil trader told Reuters news agency, �This looks like the beginning of a trend that will translate into the slowing down of U.S. production declines. I�m adding to my short position in spreads�.

This view was supported by the news June 9 reporting LTO pioneer Continental Resources Inc. was picking up service rigs and frac crews to reduce its fraclog in the Bakken. Reports say the U.S. exited 2015 with 4,290 DUC wells waiting for completion which, in most cases, costs more than drilling. That said, Continental CEO Harold Hamm said his company had no intention of resuming drilling until WTI reached $60. He was also optimistic WTI could exit 2016 at $70 because of the rapid rebalancing of global crude supply and demand.

On Wednesday July 15 Goldman Sachs resumed its pessimistic outlook with a research report stating, �On an aggregate, we view the price recovery as fragile�. The latest bearish outlook from Goldman is remarkable considering the June 13 monthly world crude oil markets report from the International Energy Agency (IEA). It contained the outlook for the remainder of 2016, and the IEA�s first stab at 2017 which is in the following chart.


From this data it is impossible to be anything but optimistic about future oil prices. The two-year massive oversupply of production versus demand (the green line over the yellow line, the blue bars above zero) from the third quarter of 2014 through to the second quarter of 2016 � sometimes as much as 2.4 million b/d � is all but gone by Q3 2016. Because of massive reductions in capital spending all over the world (Wood Mackenzie currently estimates the aggregate value of cancelled oil development projects to be over $1 trillion) and the natural decline of all reservoirs, falling supply and rising demand for the next 18 months will create the best conditions for higher prices since 2013 and early 2014. Then WTI at or near $100 a barrel was common.

The IEA also admits it has underestimated demand growth. It forecast a consumption increase of 1.2 million b/d in 2016 but reported an actual increase of 1.6 million b/d in Q1 2016. Regardless, the IEA has only increased estimated demand growth for 2016 by 100,000 b/d - 8 percent - despite being low by 33 percent in Q1. Higher than expected oil consumption could accelerate price increases. Some analysts have consistently noted IEA demand estimates are usually excessively conservative.

The IEA cautions the return of Canada�s oil sands to the market or the potential outbreak of peace and tranquility in Nigeria, Libya and Venezuela could change this outlook. Okay. Every forecast must carry these caveats. But the tall foreheads in Paris who study global oil markets do not believe U.S. LTO production will recover materially or that Iran�s current and planned production increases will actually affect world crude markets. OPEC is at or near peak output. Middle East OPEC members are having to add more drilling rigs just to sustain output let alone increase it.

The IEA estimates world oil demand will be nearly 97 million b/d by Q4 2016 but some analysts still figure that 12, 20 or even 100 more rigs drilling LTO in the U.S. is going to cap the world oil price. Rubbish. The U.S. oil rig count would have to double to actually move the needle in the face of continuous LTO reservoir decline rates exceeding 100,000 b/d per month.

The problem is the massive machine that put 4 million b/d of U.S. LTO on stream from 2010 to 2014 no longer exists. It was fueled by $100 oil, hundreds of operators of varying sizes, red hot equity markets, open and reckless debt markets, and nearly 1,500 drilling rigs operating every day supported by an over-levered fracking and oil service infrastructure now on its knees if still in business.

To grow production at this rate the cash to pay for drilling, completions and tie-ins was plentiful and came from a variety of sources. While oil prices may be rising there�s just no cash. Many LTO developers have gone bankrupt and many more are up against their credit facilities. Junk bond buyers are more concerned with getting their money back from past investments than writing cheques. When cash flow increases with oil prices in many cases the first call will be by lenders. Squeezed drilling and service operators are in no position to extend credit to struggling operators.

It will take some time to completely refuel the LTO development machine. Those who figure U.S. LTO output will track WTI in a straight line clearly don�t understand the complexities of how this large and complex business, fueled extensively by external capital, actually works.

So drilling and service can relax. With the exception of oil sands, the North American upstream oil and gas sector is more likely to be in the early stages of a long-term recovery than experiencing a short-term blip.

Courtesy of David Yager for Oilprice.com 

The views and opinions expressed herein are the author's own, and do not necessarily reflect those of EconMatters.

EconMatters All Rights Reserved | Facebook | Twitter | YouTube | Email Digest | Kindle

Tuesday, June 21, 2016

Natural Gas Market Above 5 Dollars by February 2017 (Video)

By EconMatters


The war on Coal for Power Generation, the cutback in active Natural Gas Rigs, lower production growth, trending nature of natural gas, and changing weather patterns are going to drive Natural Gas prices much higher over the next two years.


EconMatters All Rights Reserved | Facebook | Twitter | YouTube | Email Digest | Kindle

Saturday, June 18, 2016

We Look at the Grains, Softs and Meats for a Rebound in Food Inflation (Video)

By EconMatters


New money came into a lot of the commodities, especially the Grains and Softs in March, fueled in some part by a weaker dollar, and the thought that a lot of these commodities have bottomed.


EconMatters All Rights Reserved | Facebook | Twitter | YouTube | Email Digest | Kindle

Thursday, June 16, 2016

EIA Inventory Report Analysis 6-16-2016 (Video)

By EconMatters


This report was much better than last week`s, and actually gives me some optimism for the next leg higher once this pullback plays itself out. Wait for the selling to lose steam, and come in and buy oil for the next leg higher in July.


EconMatters All Rights Reserved | Facebook | Twitter | YouTube | Email Digest | Kindle

Wednesday, June 15, 2016

API Oil Report is Just Making Up Numbers (Video)

By EconMatters


With over a 5 Million Barrel miss in Gasoline Stocks, and nearly a 3 Million miss in Distillate Stocks API really takes the cake for incompetence today, almost surpassing Janet Yellen.


EconMatters All Rights Reserved | Facebook | Twitter | YouTube | Email Digest | Kindle

Saturday, June 11, 2016

Natural Gas Market Weekly Analysis 6-11-2016 (Video)

By EconMatters


Natural Gas continues its breakout, and we review the fundamental news for the week, and look at the technicals in this video. A lot of how far natural gas can run this summer depends upon whether we get a hot or mild summer. This is why while at BP they had 13 people interview a poor meteorologist for at least 3 hours because weather forecasting is that damn important in the natural gas market.


EconMatters All Rights Reserved | Facebook | Twitter | YouTube | Email Digest | Kindle

Friday, June 10, 2016

Supply Glut Continues, What Will Happen with Oil Prices?

Here are several quick looks at the oil supply glut and whether it is likely to worsen, hold the same, or improve during the summer of 2016. 

First, a picture of the cost of the oil supply glut


This snapshot of a major oil company epitomizes what is happening in most oil companies, big and small:
Shell�s job losses are about to match Facebook�s total payroll. Royal Dutch Shell just announced it will eliminate another 2,200 jobs, mostly due to the oil glut price crisis. This will bring Shell�s total job losses by the end of 2016 to 12,500 people who have been terminated. 
�These are tough times for our industry,� Paul Goodfellow, Shell�s VP in the UK and Ireland, said in a statement. �We have to take further difficult decisions to ensure Shell remains competitive through the current prolonged downturn.� (Oilprice.com)
Shell has also said it will dispose of $30 billion in assets to raise cash in order to make it through the crisis. (To the extent Shell is feeling the bite, so are all the rest.)

Persian Gulf bank oil oversupply engulfs banks in region  


Now a quick pic of how the oil supply glut is hitting banks in far parts of the world: More than 65% of banks in the Persian Gulf reported an increase in defaults in the first quarter of the year. 
�The days of double-digit profits and expansion plans are gone,� said one United Arab Emirates-based banker. �Now, it�s all about single-digit growth and controlling costs as bad loans are going to keep getting higher. It�s the new normal.� (NewsMax)
Banks, in other words, are rolling back their profit hopes and settling into the idea that oil prices in the current low range are the new norm.

The oversupply of oil means ports are swamped with oil tankers


This picture of one port tells a major story: Tankers are running circles around the Chinese port of Qingdao. One ship has been carving circles in the water for twenty days, waiting for a chance to offload at any one of several �teapot� (small) refineries in the region.
China is the world�s second largest consumer of oil. Lack of available storage capacity on land is slowing down the rate at which refiners can take in crude, as is a reduction in the profitability of refineries, which is causing them to back off on refining. 
�Weakening margins are likely to have a stronger impact on independent refineries in China and this will lead to lower crude imports,� said Hong Sung Ki, a senior analyst at Samsung Futures Inc. in Seoul. �That will result in a downward revision for China demand and this will inevitably have a negative impact on oil prices.� (Bloomberg)
Again, a picture that looks likely to worsen over the summer.
Another reason China is awash in oil along its shores is that many OPEC nations took out loans from China that were repayable in oil, not dollars. These nations are now repaying their loans in oil to get more loans in money because they have a lot more oil than money. That�s causing more oil to flow to China than it can use. Yet another reason for oil oversupply in China is that Saudi Arabia, Russia and Iran are all caught up in a oil price war over market share in Asia. That, too, is not going away.

Oil supply looks constipated off the coast of Singapore, too. 

�I�ve been coming to Singapore once a year for the last 15 years, and flying in I have never seen the waters so full of idle tankers,� said a senior European oil trader a day after arriving in the city-state�. �The volumes of oil stored at sea in South East Asia � predominantly Singapore and Malaysia � appear to have increased significantly,� said Erik Broekhuizen, Global Manager of tanker research and consultancy at New York-based shipping brokerage Poten & Partners�. �Prices are unlikely to rise too much as the specter of glut is still there�.� (Reuters)
Tanker traffic, alone, in Singapore looks like this right now:
� like rush hour on the freeway or like swimmers in the ocean at Waikiki. Add in all the other kinds of vessels, and it looks like you could walk across the straits, leaping from vessel to vessel between any two points of land. The number of tankers that are serving as offshore oil storage in the area is increasing at a rate of 10% per week.

Who is creating this tanker backup and does it have anything to do with jacking up oil prices? 

Glencore, has built up a massive inventory stake in the Brent market � which it is holding for offshore storage in its tankers in hopes of pushing the price.� As Reuters details � Glencore has built up one of the largest positions in part of the Brent crude market which acts as a benchmark for global oil prices since the start of the year�. According to Reuters Glencore is quietly cornering the Brent market, by holding more than a third of the 37 BFOE cargoes loading in June and is expected to acquire more. (Zero Hedge)
So, yes, this is, at least in part, according to Reuters, a �rigged� market, pardon the oil industry pun. Oil prices are being manipulated upward by some serious attempts to corner the market.  

Is the backup of oil tankers a sign of oil oversupply in other parts of the world?


Yes, the backup of oil tankers is getting bad in other ports of the world. Here�s a snapshot from Norway. One new Great Recession Blog reader today writes,

Outside my window I can see 6 supply/stand-by ships from the oil industry without assigment! And they are everywere along the Norwegian coast! So Norway is in no way doing as great they like to show off to the world. Its going downhill�..

But is this backup of oil tankers financially insane?


Storing oil in tankers doesn�t come free. You pay by the day, so profits of the shipment go down the longer the oil sits on the sea.

The need to store oil is so strong that traders are calling up banks to finance storage charters despite there being no profit in keeping fuel in tankers at current rates. �We are receiving unusually high amounts of queries to finance storage charters,� said a senior oil trade financier with a major bank in Asia. �These queries come from traders fully aware that they will not make a profit from storing the oil. This isn�t a trade play, it�s the oil market looking for places to store unsold fuel,� he added�. A trade financier at a European bank said there had been a �spike in interest from oil traders to finance their storage needs� since the start of the year as onshore facilities were almost full�. �There is clearly still far too much physical crude going around for the glut to be over,� said the European oil trader after flying in to Singapore. �And the paper market seems blissfully unaware of it.� (Reuters)
Ah well (sighs). I�ve been trying to make them aware of it! But people don�t see what they don�t want to see, even when an oil slick is floating right past them.

What is oversupply likely to do to oil prices this summer?


A quick view from one major oil trading company. SCS Commodities Corp says that the �latest rally has come to an end� and reports: 
Record inventory gluts at storage hubs from Cushing to Rotterdam exacerbated by supply gains from core OPEC members � [even as ] Canada�s wildfires disrupted output by more than expected this week�. The median estimate for lost Canadian barrels � is still about 1m bpd�. Cushing stocks and overall U.S. inventories both built to new record-highs with help from a flood of imports into the U.S. Gulf Coast. Overseas, Libya�s Hariga port loaded a 650k bbl tanker for the first time since April following the completion of a deal between Tripoli and eastern Libyans. (Oilprice.com)
Canada�s temporary oil supply interruption could go away as quickly as Libya�s did, causing the supply glut in the US to build at a quicker pace. US refiners also still have 10,000,000 barrels of crude in floating storage in the Houston area. And US oil rig count finally ended eight consecutive weeks of free fall, holding flat last week. Nigeria�s production, which helped pick up oil prices when it fell due to attacks on Nigeria�s pipelines, is already returning toward normal.
Saudi output is expected to increase this summer because Iran has fully entered an Asian price war with Saudi Arabia in Asia, and the Saudis will fight back for market share:

Iran has regained almost half of its pre-sanctions European market, and exported 1.7 million bpd to Asia in April. Last week, Iran introduced a discount on the June contract for its heavy crude going to Asia, just a few days after Saudi Arabia announced a price increase for its own June contract for the continent. With the discount, Iranian oil will be noticeably cheaper for Asian clients than both Saudi and Iraqi crude. (Oilprice.com)

Nevertheless, the inventory build in the US dropped more than expected in the latest report today, bringing oil prices to a seven-month high. In spite of the storage drop, however, oil failed again to push through $50, which has been looking more and more like a firm ceiling.
Of course, if the Fed does what it cannot do but says that it will and raises interest rates, that will raise the value of the dollar, making petrodollar-priced oil more expensive for most of the world, which would likely suppress global demand a little, countering the normal summer rise in gasoline demand around much of the world.
So, all is fragile and continues to hang in the balance daily, but the factors that have reduced the glut appear to be abating, while some of those that could increase it are growing.
Courtesy of David Haggith, The Great Recession Blog
The views and opinions expressed herein are the author's own, and do not necessarily reflect those of EconMatters.

EconMatters All Rights Reserved | Facebook | Twitter | YouTube | Email Digest | Kindle

Thursday, June 9, 2016

Gold: A Great Junior Game

It wasn't so long ago that some of the more famous investor gurus were shrugging off gold as nothing more than shiny trinkets with no investment value. They were wrong. This safe haven is back, the recovery is clear, and there have been some very big changes of heart. 

The biggest gold producers in the world have seen their share prices double this year. Not only are gold prices soaring, but producers are cutting costs and slimming down debt as they pave the way for gold to return to the top of the favored commodities list. 

Even though gold dropped earlier in May, Thompson Reuters noted that shares outstanding for two major ETFs tracking gold rose 11 percent, and precious metals ETFs enjoyed four straight weeks of inflows in May. A ton of money is moving around here. 

And thanks to an overvalued U.S. dollar, gold may have nowhere to go but up. 

Gold has no upper limit on its price, and according to Harvard economist Kenneth Rogoff, speaking to the Financial Times recently, emerging economies might do well to shift all their U.S. dollar reserves to gold. Gold, he says, could be viewed as �an extremely low-risk asset� with average real returns comparable to very short-term debt. 

Russia, it seems, would agree. Moscow hates the U.S. dollar and craves gold, tripling its gold holdings between 2005 and 2015. 

Weak prices, stock market vulnerabilities, and a weakening currency in 2015 also led Chinese investors to buy almost 1,000 metric tons of gold as a safe haven asset

Major Money, Massive Returns 

Billionaires have certainly taken notice. They are dumping massive amounts of money into gold right now and seeing huge returns. They are now ahead of a game that has seen prices rise almost 14 percent this year�even with the recent correction. 

Take George Soros, for instance, who recently invested $475 million into Barrick Gold, which has since doubled in value. 

Well-known Canadian mining philanthropist-investor Frank Giustra also appears to be excited about the recovery of gold, buying close to 13 percent of a high-potential junior miner, Sandspring Resources, which is advancing a major gold prospect in Guyana. 

Marc Faber, the author of the Gloom, Boom and Doom report�known to offer dreary outlooks on stocks and investments�told CNBC last week that he believes gold, oil and gas shares have �significant upside potential in 2016� as investors hope to use them as long-term stores of value. 

Part of the upside potential is based on the fact that gold has gotten much smarter. Commodities downturns encourage innovation. Gold is surging in part because its miners have become much more efficient, according to Bloomberg. It's not just about more attractive exchange rates for miners outside of the U.S. 

The amount companies are spending to produce an ounce of gold today has fallen by around 34 percent since 2012, the news agency says. This is what long-term billionaire investors want to see, and it's why they are comfortable putting big cash into gold right now. 

In response to particularly weak U.S. job growth rate in May, the price of gold jumped by nearly 3 percent last week, and it's still maintaining this bullish attitude. 

Bullion may have suffered a price dip earlier in May, but the per-ounce rate remains almost 15 percent stronger than the beginning of the year. 

The first few days of June have also seen gold prices spike upward, signaling a swift recovery from mellow May and a continuation of 2016's legacy as a golden year for the namesake commodity. 

While all major gold stocks have had an amazing year so far, the top three, according to ProfitConfidential, are Barrick Gold, up more than 160 percent year-to-date, Goldcorp, up more than 40 percent, and Newmont Mining, up 75 percent. 

Fundamentally, Gold is Now a Great Junior Game 

The first quarter of this year has made it brilliantly clear that junior miners are a good bet. Their fundamentals are stronger than ever�and this is, after all, where all the initial exploration work is done. 

It's not just the major miners who are getting smarter and more efficient. The juniors have been producing at all-in sustaining costs coming in hundreds of dollars lower than the per ounce price. Operating margins have never looked better. 

But the best part for the savvy investor is that everyone catches on first to the major miners, while the juniors stay off the radar, which means that while gold prices surge, there is a short window of opportunity when the juniors are selling cheap. Even so, many of them have seen their stocks double since early this year. 

Sandspring Resources, for one, is focused on advancing its 100 percent owned, 6.9-million-ounce Toroparu Gold Project in Guyana. It also continues to explore its over 98,000-hectare highly prospective concession. 

Toroparu is the fourth-largest gold deposit in South America held by a junior instead of a major, offering great upside with a rising gold price and as a potential acquisition target. 

Other juniors could also benefit from the recovery of gold while their shares remain cheap enough to lure in new investors, including GoGold Resources, with its flagship project in Mexico; Pilot Gold, in Turkey, Utah and Nevada; or Lydian International focused on Armenia and Georgia. 

What happens with juniors is that they do all the heavy lifting, and then the majors swoop in with the big money once a new discovery is ready to be mined. 

While the major miners are already enjoying a stunning revival and the billionaire investors are already raking in the revenues, the juniors are the next spot on this high-speed commodities train, because this is where the real reward will be�and it just got a lot less risky. 

Courtesy of James Stafford of Oilprice.com 

The views and opinions expressed herein are the author's own, and do not necessarily reflect those of EconMatters.

EconMatters All Rights Reserved | Facebook | Twitter | YouTube | Email Digest | Kindle